
Update Oct 2015
I've now written a web-tool that automagically converts
Google Maps directions to GPX format. Its pretty awesome!
Take me to the new article
Oh dear, this is going to be one of these things that make you go d'oh.
If you just want to know how the tech bits and skip the narrative you can jump to the Solution section below.
I have a now rather ancient Garmin SatNav, a Nüvi 1690. I bought it a few years back when I realized that renting a GPS device with my rental car would be more expensive after the second time than buying a new device.
This little device has paid for itself many times over by now. However the process of getting data points to the device prior to a trip has always been a very complicated and round-about way one which I've vowed to make smoother every time I go through it.
My Process
I like to plan my medium to long trips using either Google Maps or Google Earth. These are excellent tools to find hotels, parking, places of interest and planning which roads to take. However neither of these two tools can handle the necessary GPS data formats (
GPX being the most common) that the Garmin tools do. The Google tools (understandably if you remember their
original acquisition source) only deal with
KML and KMZ data formats.
This has required me to take the following steps:
- Plan points and routes in Google Earth/Maps
- Save waypoint data from Google Earth to KML file
- Convert KML file to GPX file (excellent tool for this is GPS Visualizer)
- Handle any data format errors
- Use any of the many Garmin tools to import the data to the device
- Sometimes I've used Google Map's "Send to GPS" feature for single points. This feature seems to have been removed from the new Google Maps.
- BaseCamp has very good support for importing waypoints and routes. It regretfully lacks support to delete said points from the Nüvi device though.
- myGarmin web page used to have an import feature with their GarminConnector plugin (but this is gone now)
- MapSource had some support for this (but this tool is discontinued now and cannot be downloaded)
- Garmin Express is simply useless when it comes to uploading waypoints (it is atrociously simple)
This time the only tool available to me was the rather nice BaseCamp tool. However I ran into some problems as I was unable to delete some previously loaded waypoints off my device. BaseCamp could not delete anything and even after deleting everything I could from the device menus there were still some points that lingered in there.
 Deleting Everything
When using Windows 7 and newer the Garmin device shows up as an external USB storage drive. So after spending a very unsuccessful hour trying to clean my previous data from the device I finally decided to open up Windows Explorer and go hunting through the mounted drive.
I finally found that the GPX folder actually held an archive of my waypoints and trips that were somehow read by the device. Deleting every gpx file in this folder removed all custom points from the device (I also removed the Archive folder for good measure).
The Garmin USB Protocol
My perception of the device communication standard has always been the thing that has scared me away from actually diving in and creating a helper application. I decided to embark on trying to understand and leverage this protocol to automate my process as much as I could.
Cutting a very long story short, after numerous attempts using their
Garmin SDK library and reverse engineering their .NET libraries I had made no real progress. The SDK samples I had, strangely just indicated that there seemed to be no compatible GPS device connected to my machine. This was weird as I could easily verify that the device was there by using their BaseCamp tool and the web-based GarminConnector (showed it connected and accessible).
Solution: USB Mass Storage Mode
Although embarrassing I, in desperation, went back to Windows Explorer and scoured through the device that was mounted as my G:\ drive trying to find any hints to how to access it.
I found a rather interesting file under the Garmin\ folder which was named GarminDevice.xml. Looking through this file it wasn't long until the shear stupidity of what I had been trying to do hit me.
I was already accessing the device! I had previously removed waypoints by deleting the files from the GPX directory, I could just as well have added a file in there with my new data!
And sure enough, this is indeed the case for a
large range of Garmin devices. Below is an explanation of the relevant GarminDevice.xml section:
The GpsData DataType element also contains a File element with TransferDirection=InputToUnit which specifies a file type, extension and file path. The application places a GPS Exchange (.gpx) file containing routes, tracks and waypoints in the directory path specified. This file will be processed by the GPS device upon exit from mass storage mode.
This has reduced the problem to a simple FileIO and XML parsing exercise which is trivial to implement using any modern programming language (e.g. C# or Python).
Stay tuned for my new app :)
 I've applied several major updates to the tool discussed in this article. Update #1, Update #2, Update #3, Update #4 and Original post.
 Since I created the
  The small Météo France site I created has been updated with a new parameter that can be used to customize the unit that windspeed is presented as.


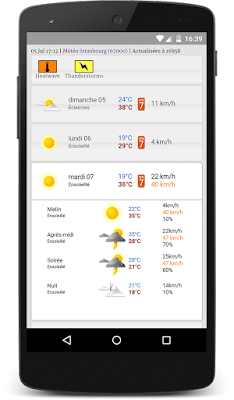 I've discussed the work I've done to build a simpler weather UI for the French météo service in earlier posts (


 The
The 

 My totally unoriginal list of things I'm still learning:


 When dealing with networked or external data sources I've learned the hard way that all code should be designed as to expect failures. It is significantly cheaper and easier to bake a graceful handling of errors this from the start rather than attempt to do it later on. A common first step in combating failures and providing resiliency is to have your logic retry an operation in case of a failure.
 In an
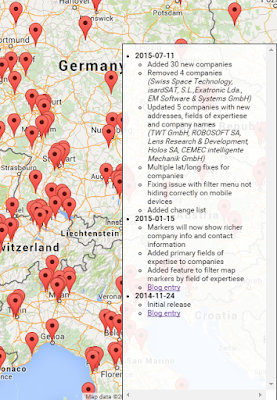
In an  Realised today that I needed a good way to create a change list document for a small app that I am writing. The app has a few hundred screens, each of which is supported by a single data document that contains the information that the screen is showing.
 After having followed all the examples on the Android developer site to the letter about supplying multiple layouts for different screen sizes and orientation I was still having issues with them on extra large screens (10" tablets).